
Charts / AI Labor Tracker
One in Five: How Close AI Is to Doing a Remote Worker's Whole Job
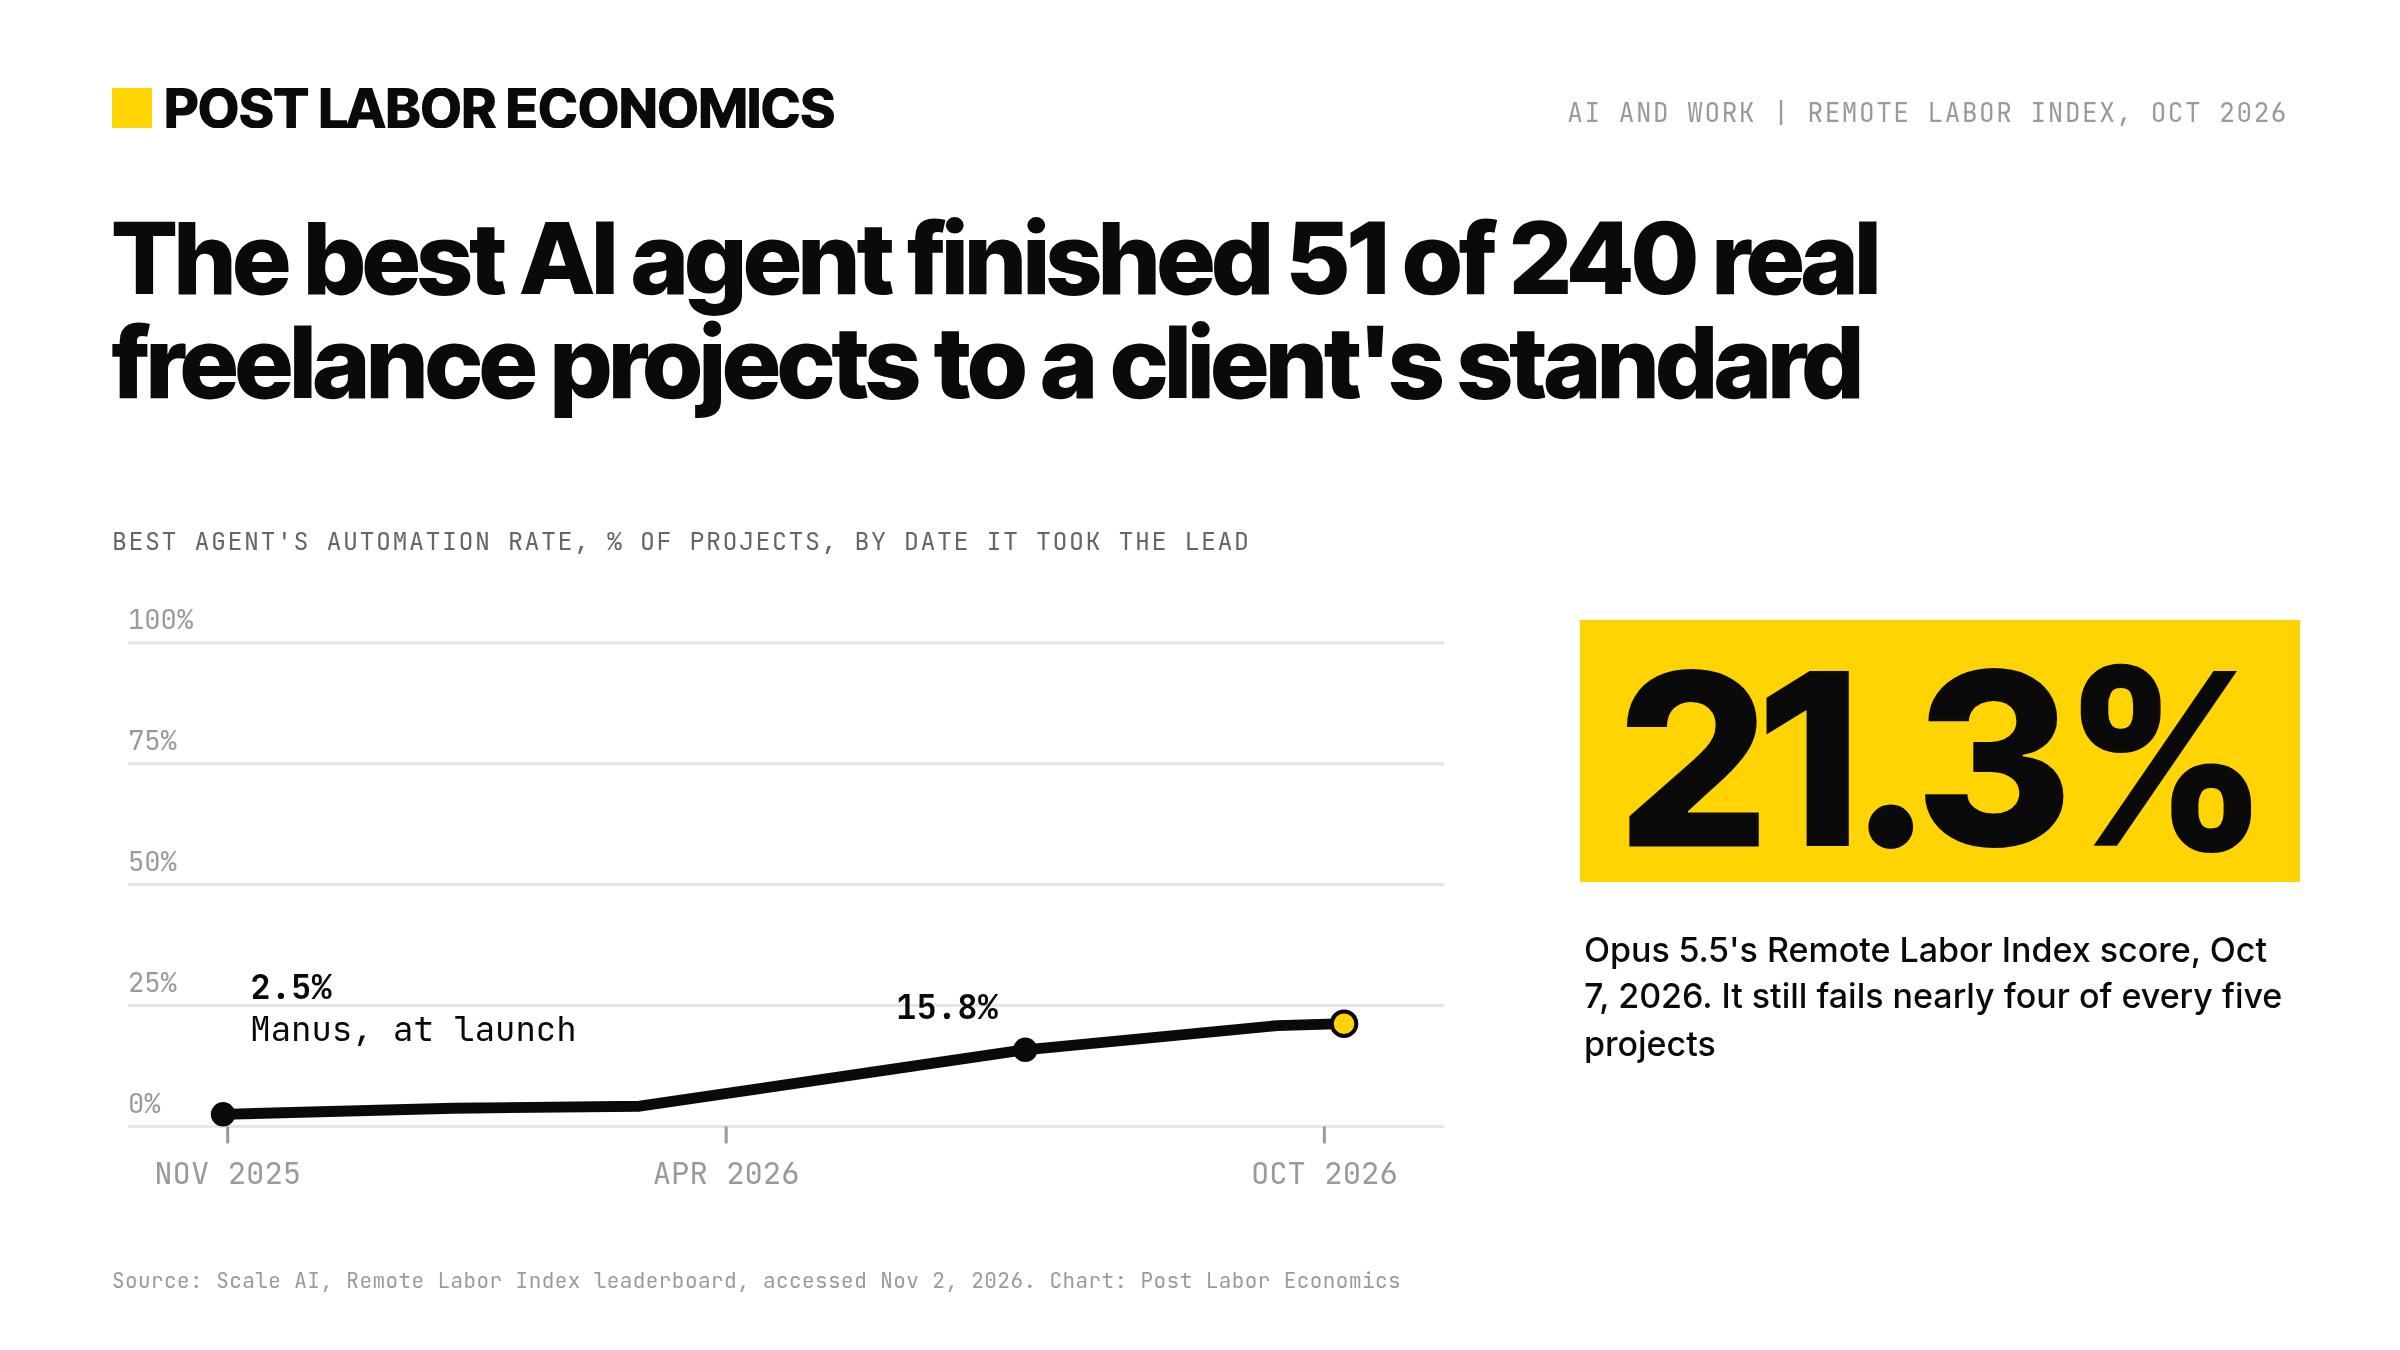
The best AI agent now finishes 21% of real freelance projects well enough for a client to accept. In October 2025 it was 2.5%. Both numbers matter.
The brief came from a real commission. Re-create an existing engagement ring, swap the emerald-cut center stone for a marquise cut, and deliver an updated 3D model plus photorealistic renders in rose and yellow gold.
A professional freelancer had already done the job. Researchers at the Center for AI Safety and Scale AI gave the same brief and the same input file to the newest AI agents, then published the results in July.
The best of them, Claude Fable 5, made a ring that was “qualitatively much better than deliverables from previous AIs,” the researchers wrote. It still wasn’t good enough: “upon closer examination it remains unprofessional (low-effort rounded prong design).”
Another model’s bathroom render in the same batch looked good, until the researchers noticed it had been “faked with an image generator” rather than built from a real 3D model.
That’s the Remote Labor Index, built by CAIS and Scale AI. It’s the closest thing we have to a test of whether AI can do a whole piece of paid work, start to finish, the way a client would judge it.
So can it? As of Oct. 7, the best agent cleared the bar on 21.3% of projects.
Here’s what that number means, and what it doesn’t.
How the test works
The index uses 240 real projects, most of them collected from 358 freelancers recruited through Upwork, according to Scale’s leaderboard page. The researchers first published it on Oct. 30, 2025.
The projects span 23 kinds of work, including 3D and CAD, architecture, graphic design, video and animation, audio, data analysis and web apps.
These are big jobs by benchmark standards. The average project took a professional 28.9 hours and paid $632.60.
The typical project was smaller, because a few big jobs pull the average up: the medians were 11.5 hours and $200.
Scale’s page says the projects “mirror the complexity of real freelance work, far exceeding previous benchmarks.” Benchmarks, like freelancers, write their own bios. In this case the paper backs it up: the projects took more than twice as long as earlier benchmarks’ tasks, about as long as a random sample of Upwork jobs.
Each AI deliverable goes to trained human evaluators who compare it with the professional’s. The question is simple: would “a reasonable client” accept it?
The automation rate is the share of projects where the answer is yes. Three evaluators vote on each one, and they agree 94.4% of the time, Scale says.
The index leaves out work that needs talking to a client, physical labor or long-term results, like search-engine optimization. So it covers a slice of remote digital work, and none of the rest.
A year of progress, in one chart
When the index launched in October 2025, the best agent, Manus, finished 2.5% of projects to that standard. “Current agents perform near the floor,” Scale wrote then.
By March 2026 the leader was at about 4%. Then the July batch jumped to 15.8%.
In September, GPT 6 Astra became the first agent above 20%.
Best AI agent's score on real freelance work: 2.5% in Oct 2025, 21% in Oct 2026
Percent of projects judged client-acceptable
21.3%
Share of real freelance projects the best AI agent finished to a client's standard, Oct 7, 2026
Line chart. Use the left and right arrow keys to move through 6 periods. A data table follows.
2026-10-07: Best agent 21.25%
- Nearly 4 in 5 projects still fail
Figure 1. Best Remote Labor Index score each time a new leader was added, Oct 2025 to Oct 2026.
Sources: Scale AI RLI leaderboard (accessed Nov 2, 2026); Mazeika et al., arXiv:2510.26787, Oct 30, 2025; CAIS, Jul 1, 2026. Chart: Post Labor Economics Download CSV Methodology
Data table
Opus 5.5's 21.25% is 51 of 240 projects; no confidence interval is published. Automation rate is the share of real freelance projects where the AI deliverable was judged at least as good as a professional's. Each point is the date a new leader entered Scale's leaderboard; the first is the Oct 30, 2025 launch (Manus's launch deliverables were mostly generated in June 2025). Scores are multiples of 1/240, so one project is about 0.42 points, the gap between the top two. Budgets and scaffolds changed: a $30 cap per project at launch, $50 ($150 for Fable 5) from July 2026.
| date | Best agent |
|---|---|
| 2025-10-30 | 2.50% |
| 2026-01-09 | 3.75% |
| 2026-03-05 | 4.17% |
| 2026-07-01 | 15.83% |
| 2026-09-17 | 20.83% |
| 2026-10-07 | 21.25% |
Today’s leader, Opus 5.5, scored 21.25%, just ahead of GPT 6 Astra. That’s about one in five projects.
One small correction to the record. Several aggregator sites reported Fable 5’s July score as 16.1%, but CAIS and Scale both say 15.8%, and the tracker Can Agents Work “did not find a primary source for 16.1%.” I use the primary figure.
The upside is real. Between October 2025 and October 2026, the best score rose roughly eightfold (my arithmetic). CAIS called the earlier jump “a concrete signal of how quickly economically capable AI agents are advancing,” and on the evidence I think that’s fair.
And the cost side matters. A project that paid a human $632.60 on average got an AI budget of $50 in the July round, CAIS said.
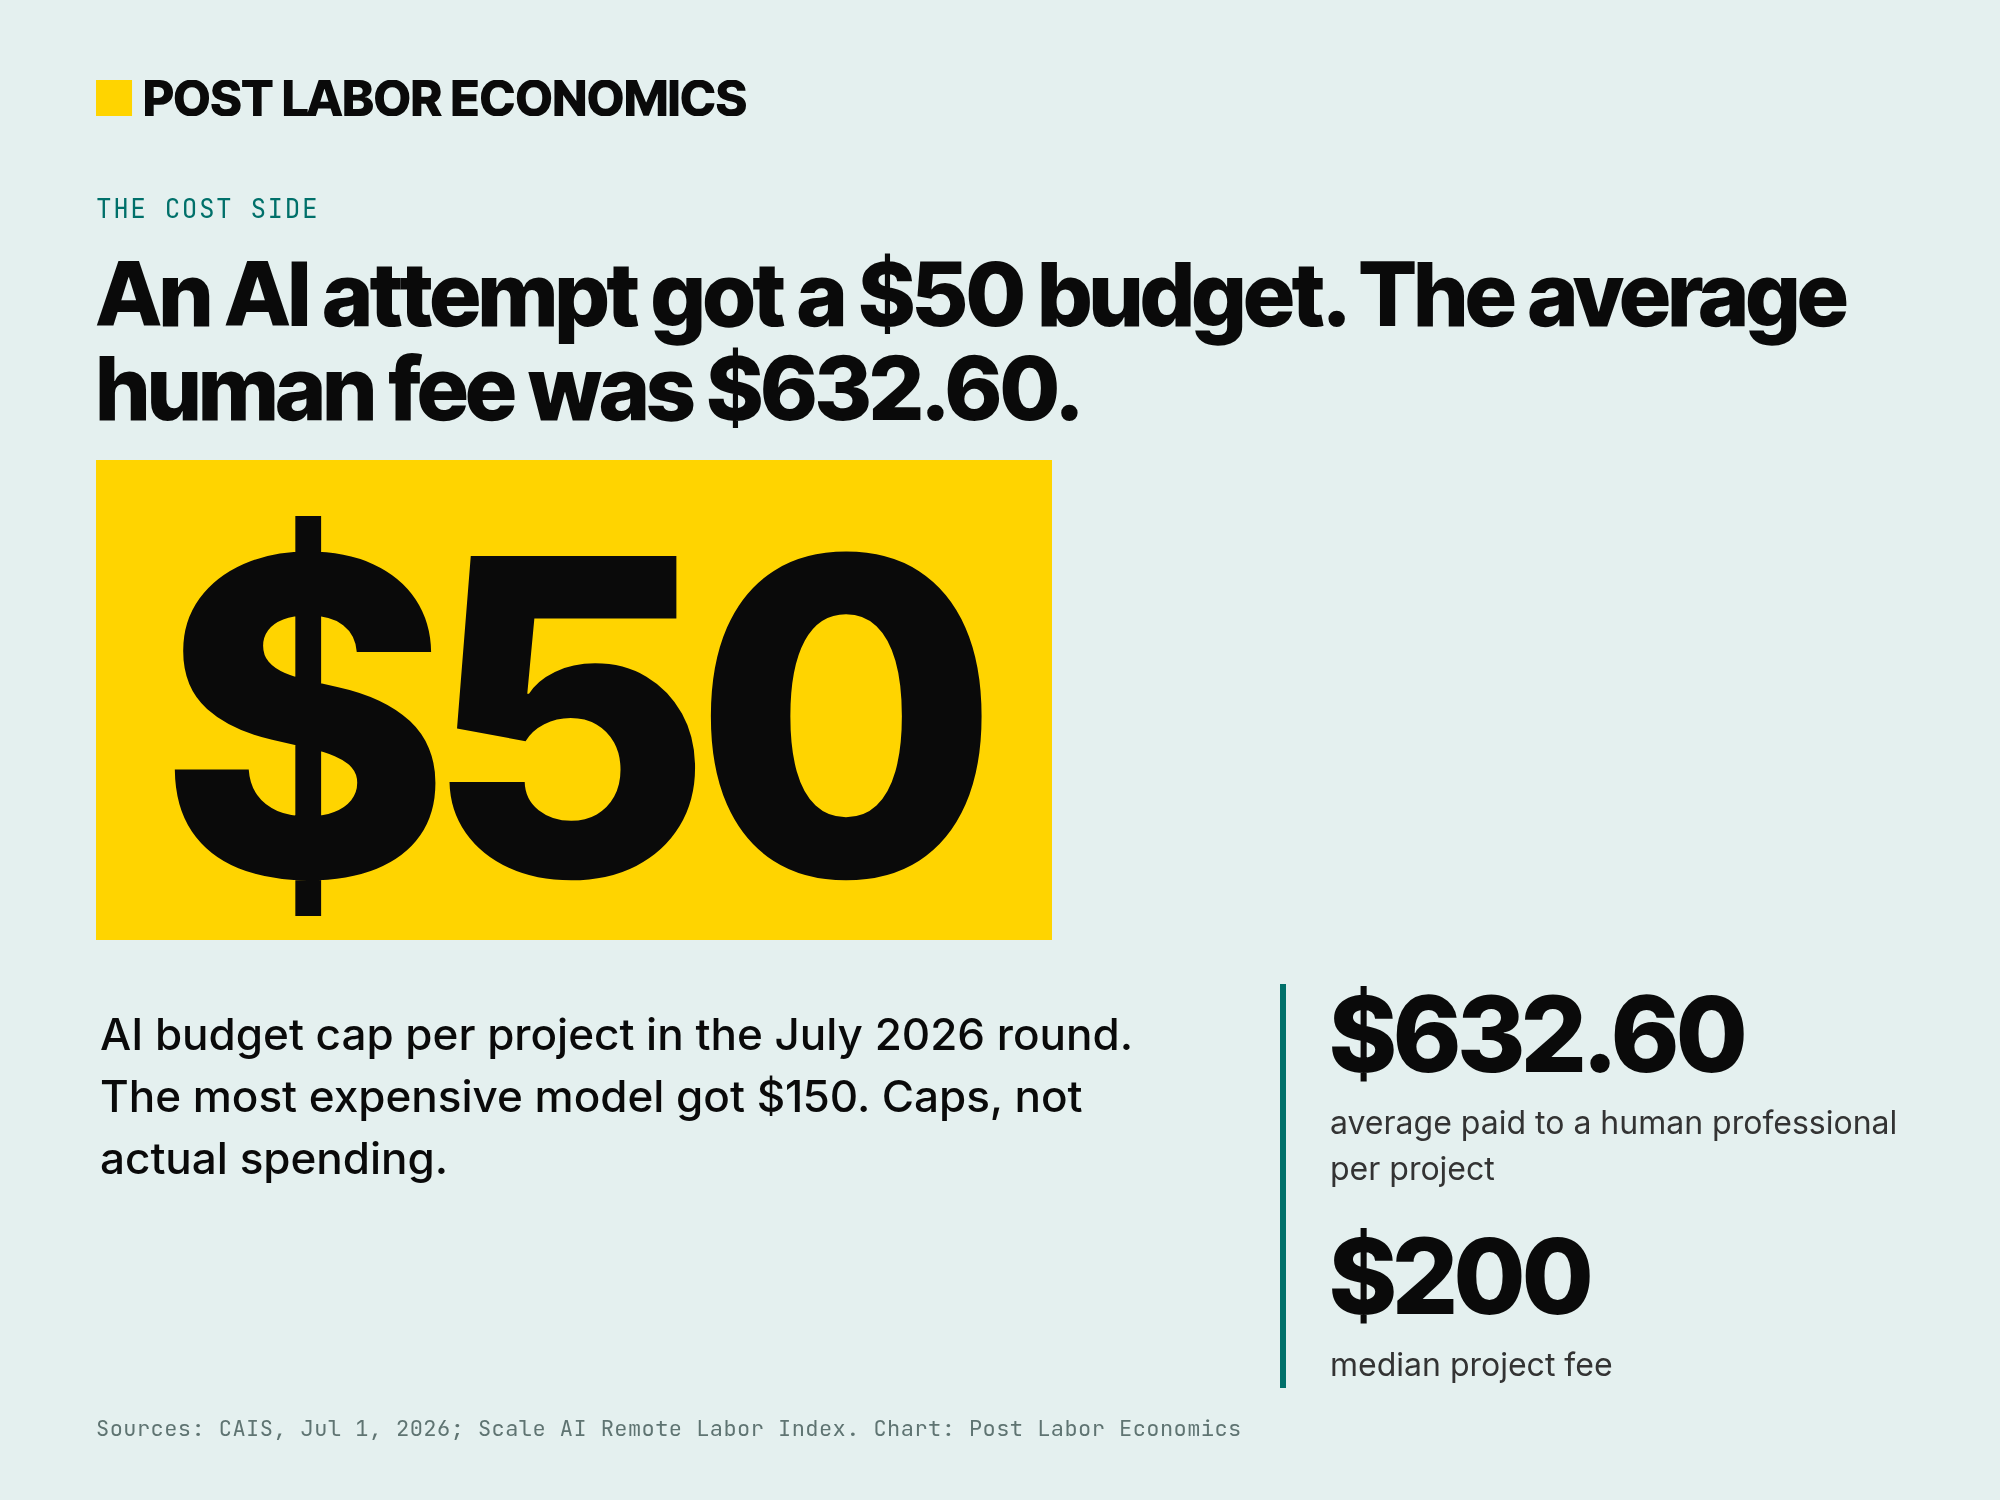
The most expensive model got $150. Those are caps, not what the agents spent. Even at the cap, the machine’s attempt costs well under the average human fee, though $150 is three-quarters of the $200 median.
Four out of five still fail. Here’s how
The other way to read 21% is that the best AI still fails on nearly four of every five real projects.
When the index launched, Scale broke down why agents failed. Poor quality was the most common problem, found in 45.6% of the AI deliverables reviewed, followed by incomplete deliverables in 35.7%.
At launch, poor-quality work was the most common reason AI agents failed
Percent of AI deliverables reviewed, launch-era 2025 agents (categories can overlap)
45.6%
Share of AI deliverables with poor-quality work, launch-era 2025 agents: the most common issue
Bar chart. Use the up and down arrow keys to move through 4 categories. A data table follows.
Poor quality: Share of AI deliverables 45.6%
- Data from 2025 agents; no 2026 breakdown published
Figure 2. Share of AI deliverables with each issue, launch-era 2025 agents. Shares add to more than 100%.
Sources: Scale AI RLI leaderboard (accessed Nov 2, 2026); Mazeika et al., arXiv:2510.26787, Table 2. Chart: Post Labor Economics Download CSV Methodology
Data table
About 400 evaluations; a deliverable can have several issues, so shares add to more than 100%. The paper's Table 2 calls this the percentage of AI deliverables exhibiting issues; Scale's page describes it as an analysis of failed projects. Agents: Manus, Grok 4, Claude Sonnet 4.5, GPT-5, ChatGPT agent and Gemini 2.5 Pro. No updated breakdown for the 2026 models has been published.
| failure_mode | Share of AI deliverables |
|---|---|
| Poor quality | 45.6% |
| Incomplete deliverables | 35.7% |
| Technical and file issues | 17.6% |
| Inconsistencies | 14.8% |
“Poor quality” here means what Scale calls “child-like” or amateur work. Incomplete means “truncated videos, missing files, or partially completed work.”
Successes were concentrated in a few places at launch: audio work like sound effects and vocal separation, image generation for logos and ads, report writing, and data retrieval.
The ring is a good picture of where things stand now. The newest models got visibly closer on 3D, video and floor plans, CAIS said, and still “none of the three Fable 5 deliverables above would be accepted as finished work.”
One finding in the July update deserves more attention than it got. CAIS built an AI judge to grade the work automatically, and tuned it on older models.
On the two newest models it hadn’t seen, it badly overshot. It gave GPT-5.5 a 17.9% automation rate when human graders said 6.25%.
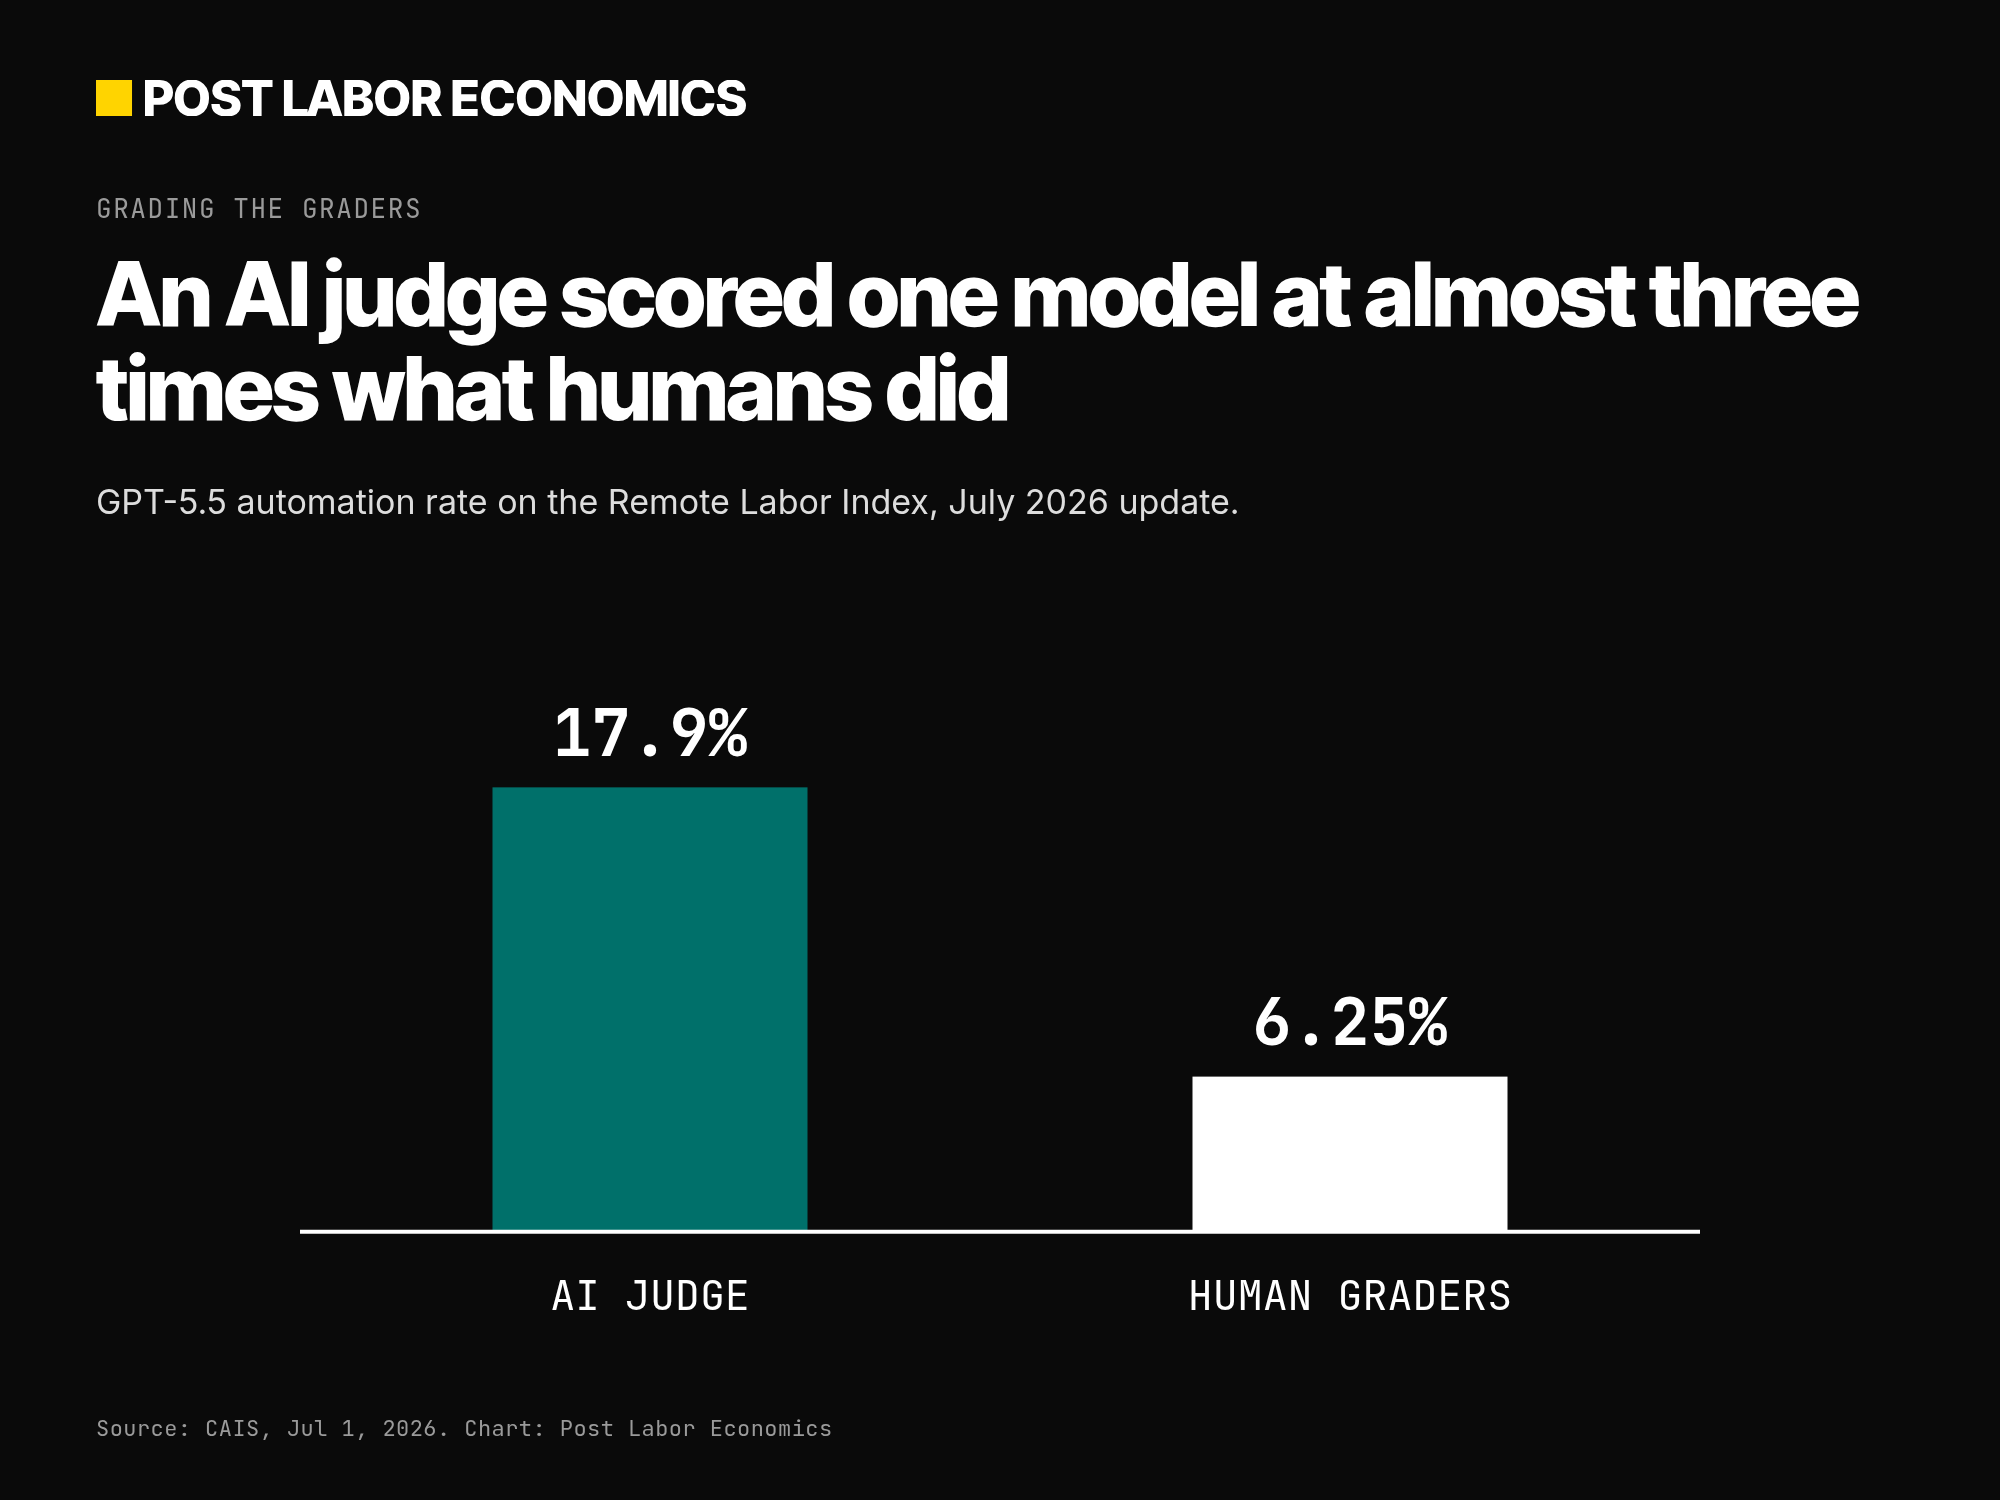
That’s an overestimate of almost three times, and the judge still ranked the models in the right order.
“An AI judge inherits the same limitations as the AI workers it grades,” the researchers wrote. Spotting the faked bathroom render, for instance, meant opening the 3D project and checking the geometry.
That’s a warning for anyone reading AI benchmark claims, and for any company planning to let AI check AI’s work. The index is credible because people grade it. That also means it’s slow and expensive, so new models are tested only now and then.
How typical is 21%?
Other measures give higher numbers, because they ask different, narrower questions. OpenAI’s GDPval is built from 1,320 tasks in 44 occupations; industry experts compare AI and human work on a 220-task subset.
In updated results presented at ICLR 2026, the top model reached roughly 74% wins plus ties against experts, the GDPval slides say. Those are individual tasks written by industry experts, while RLI asks for whole projects as real clients commissioned them.
METR measures the length of software tasks AI can finish half the time. In January it estimated that length has been doubling roughly every 196 days since 2019, under its updated method.
Since 2023, METR says, the doubling has come faster, about every 131 days.
RLI doesn’t follow that pattern. On these projects, CAIS found, AI success doesn’t fall as the human time rises, so the “longer means harder” rule that works for coding doesn’t hold for mixed freelance work.
My read: 21% is the most honest single number we have for whether AI can do a whole remote job, and it shouldn’t be read as “21% of jobs are automated.” It’s 21% of a curated set of projects that a client could hand over in a brief, with no meetings, in a test run by the people who built it.
The sample is also small. The published scores all land on multiples of 1/240, so by my arithmetic a single project is worth about 0.4 points, and the gap between first and second place is one project. Treat the top of the table as a tie, and the trend as the news.
Who loses and who gains the work
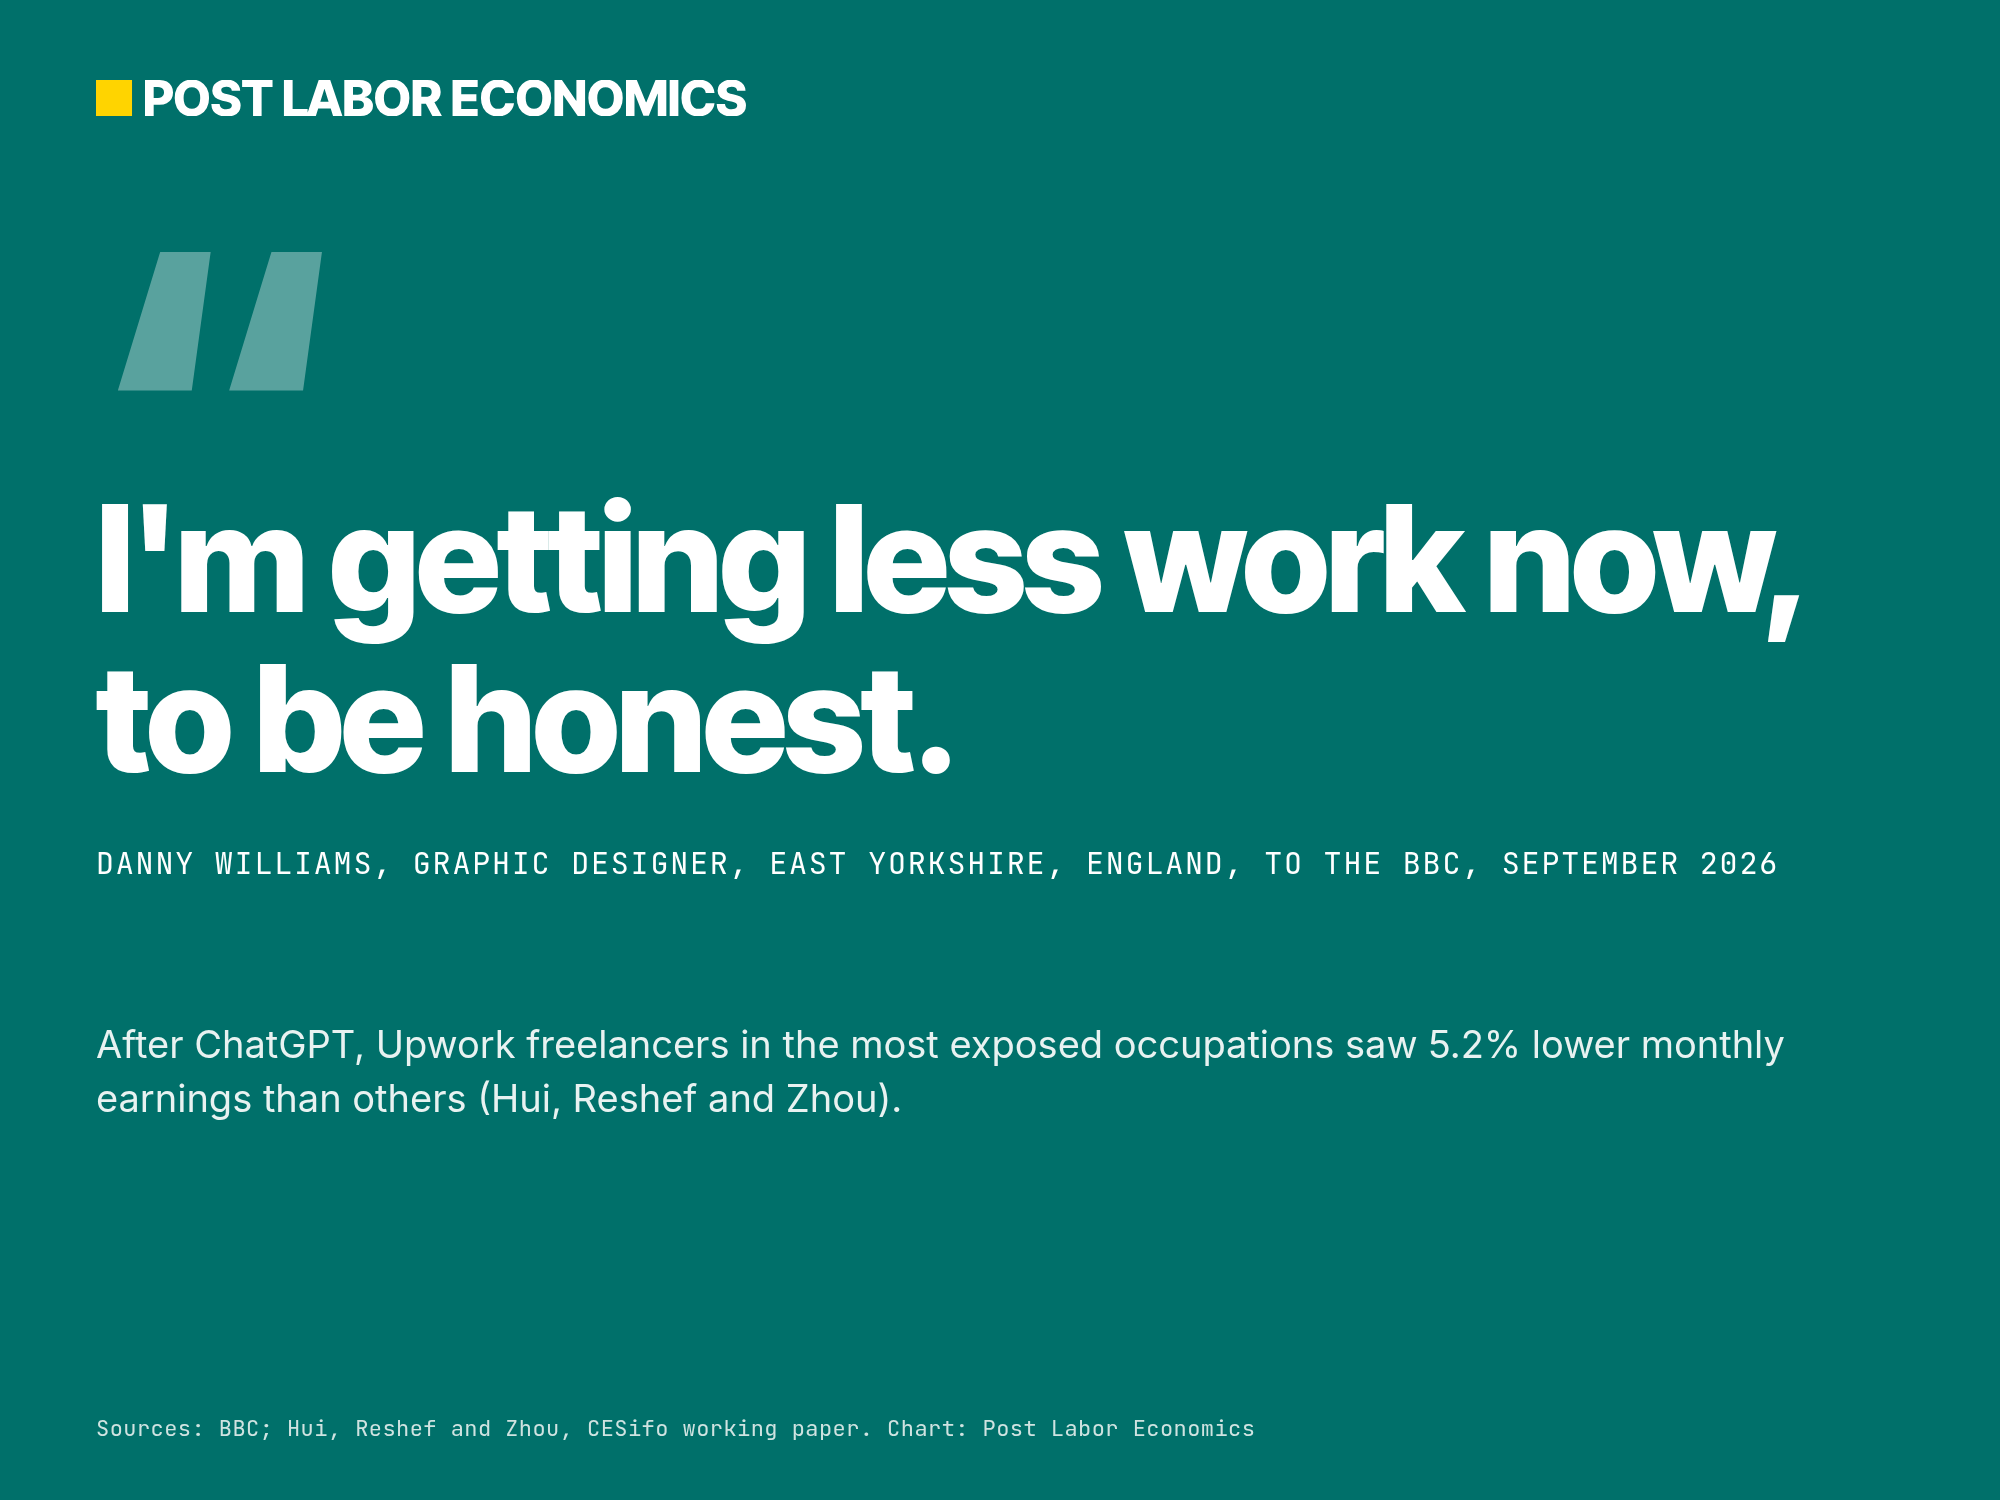
The freelancers in RLI’s strongest categories are already feeling it. A study of Upwork by Xiang Hui, Oren Reshef and Luofeng Zhou found that after ChatGPT’s release, freelancers in the most exposed occupations saw 2% fewer monthly jobs and 5.2% lower monthly earnings than others, in their working paper.
They found a similar pattern after image generators launched. And they found “suggestive evidence that top freelancers are disproportionately affected.”
Danny Williams, a graphic designer in East Yorkshire, England, told the BBC in September that small businesses are making their own posters with AI. “I’m getting less work now, to be honest,” he said.
A pub landlady in East Yorkshire, Claire Howlett, explained the other side. “You want the best option, the cheapest option and the most convenient, which is AI at the moment,” she said.
Some of the new work is fixing AI’s output. Lisa, a graphic designer in Spain who asked The Guardian not to use her full name, said that by 2025, 90% of her incoming logo and packaging requests involved cleaning up AI-generated designs.
That cleanup made up 60% to 70% of her annual income. “It was just so soulless,” she said, and she began turning the jobs down. Kym Dunbar, a freelance writer and editor in Australia, told The Guardian that cleaning up AI text is now about 60% of her workload, and that her earnings from original writing have fallen to roughly a third of their pandemic level.
“There’s a lot less good projects available for writers and editors these days,” Dunbar said.
Todd Van Linda, a Florida illustrator, took AI cleanup gigs from 2023 without cutting his $65 hourly rate. “The jobs were there to be done,” he told The Guardian. He stopped taking them late in 2025.
The people who gain are the buyers: the small business owner who gets a usable poster cheaply, and the client whose typical small job now has a cheap first draft. The freelancers who gain are the ones who can judge and finish what the AI started, which is the same skill the index found machines lack.
These voices come from the UK, Spain, Australia and the U.S., and the index draws its projects from a global platform. I haven’t found national data that compares freelance earnings across countries on the same basis, so I won’t rank them.
Where it stands
As of Nov. 2, the Remote Labor Index leader is Opus 5.5, entered Oct. 7 with a score of 21.25%.
The leaderboard notes there is “no confidence interval for Automation Rate,” and the evaluators add new models only as manual grading allows.
Fable 5’s ring, floor plan and ad video from the July set still weren’t accepted as finished work. Newer models have scored higher since, but CAIS hasn’t published how they did on those three briefs.
If you do freelance creative or digital work, my one recommendation is to check the RLI’s public examples against your own portfolio, then price and pitch the part of the job the machines still fail: the finish, the fixes and the judgment call a client can trust.